
The Canadian housing market has encountered a difficult obstacle on the path toward a traditional autumn recovery, with new data revealing that every single province recorded a decline in home sales this August compared to the same period a year earlier.
According to the latest monthly release from the Canadian Real Estate Association (CREA), residential sales across the country totaled 37,504 units in August. This figure represents a 6.9 per cent drop from August of the previous year. On a month-over-month basis, activity slipped 0.7 per cent from July after accounting for seasonal adjustments. Market activity has effectively remained flat and drifted sideways since May, signaling a persistent cooling trend that defies hopes for a swift seasonal rebound.
The broader economic backdrop compounds the challenge. The comparison year of 2025 was already historically weak, marked by 470,314 national sales—a 1.9 per cent contraction from 2024. Consequently, the latest August decline piles on top of a market that had already contracted significantly. Through the first eight months of the year, cumulative sales for 2026 were down 5.3 per cent compared to the same period in the previous year.
Regional breakdowns illustrate the widespread nature of the downturn. Alberta experienced a sharp 11.5 per cent annual decline in August sales, while New Brunswick saw transactions fall by 8.7 per cent. Quebec recorded a 7.3 per cent decrease, and Ontario posted a 6 per cent drop. Even Saskatchewan, which has historically demonstrated stronger resilience due to better relative affordability, saw sales slide 2.4 per cent annually.
These downward figures carry significant implications for real estate professionals operating outside the country’s most expensive metropolitan hubs. While relative affordability has successfully supported price stability in several regional markets, it has clearly failed to insulate overall transaction volumes from the broader macroeconomic slowdown.
Sellers Are Adding Competition
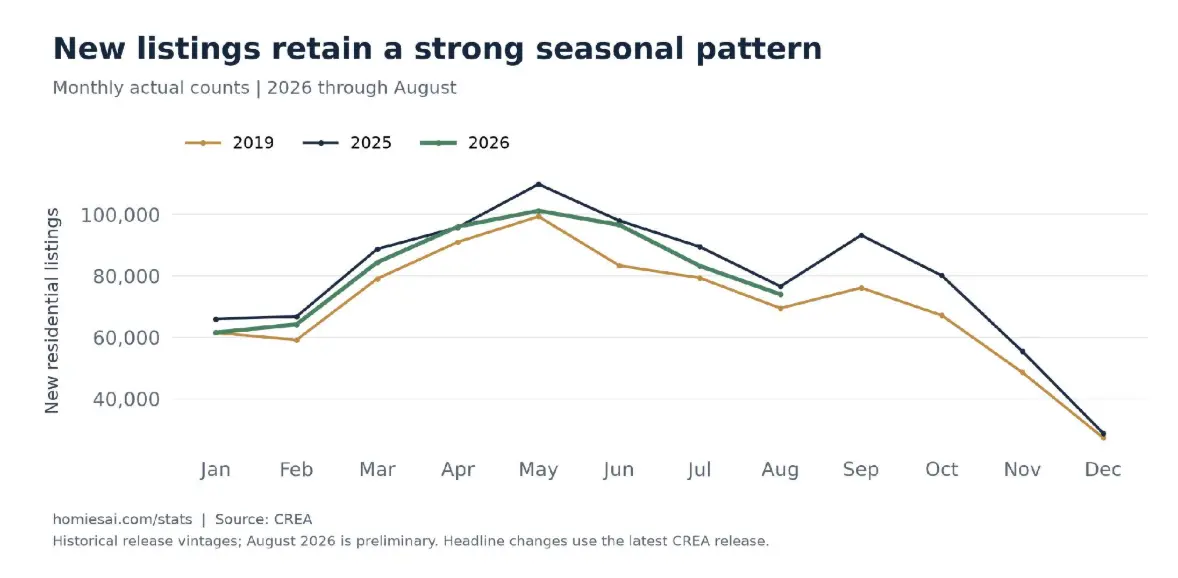
As sales activity tapered off, the dynamics between buyers and sellers began to shift further. Seasonally adjusted new listings rose 3.3 per cent from July levels, creating a widening gap against declining sales volumes. Because inventory expanded while purchases slowed, the national sales-to-new-listings ratio dropped from 51.1 per cent to 49.1 per cent, placing it comfortably below the long-term historical average of 54.7 per cent.
For individual property sellers, the practical problem is straightforward: a greater number of competing properties have arrived on the market without a matching influx of active buyers.
However, context remains essential when evaluating supply metrics. Actual unadjusted new listings in August remained 3.2 per cent below the levels recorded in August 2025. The reported increase was strictly a monthly phenomenon calculated after stripping away predictable seasonal patterns. Consequently, characterizing every supply metric as surging would be misleading.
National inventory hovered just below 200,000 properties for sale, marking a 1.4 per cent increase year-over-year and aligning closely with normal historical norms for the month of August. Months of inventory stood firm at 4.8 months, a metric that has remained completely unchanged for four consecutive months. CREA’s primary national metrics continue to describe a balanced housing market, though the balance of bargaining power is gradually tilting back in favor of prospective buyers.
Significant disparities persist at the provincial level. Ontario posted a seasonally adjusted sales-to-new-listings ratio of just 41.9 per cent, while British Columbia stood at 45.3 per cent. In stark contrast, Saskatchewan registered a tight ratio of 67.8 per cent, and Manitoba stood at 65 per cent. These regional divergences mean that a pricing strategy tailored for a scarce inventory environment in Saskatchewan will prove entirely ineffective in a heavily supplied Ontario neighborhood.
The Price Divide Is Real and Increasingly Untidy
On the pricing front, the national composite benchmark price remained completely unchanged in August, leaving it 3 per cent below where it stood a year earlier. Meanwhile, the national average sale price rose 0.6 per cent to $668,219. Market analysts frequently distinguish between these two metrics: the average sale price fluctuates based on the shifting mix of property types that happen to sell in a given month, whereas the MLS Home Price Index is specifically engineered to track price changes for comparable benchmark homes.
A modest annual increase in the average sale price serves as poor evidence that the typical Canadian home is actively appreciating. Similarly, the shrinking annual rate of decline in the Home Price Index deserves careful scrutiny. Because home prices have remained largely flat since the spring, any improving year-over-year comparison is often the result of "base effects"—meaning the comparison month from the previous year has simply grown weaker. This statistical shift does not require current home prices to be rising today.
Regional results from the Home Price Index highlight where market damage remains most heavily concentrated. In CREA’s seasonally adjusted tables, benchmark prices in the Fraser Valley fell 7.1 per cent annually, Kitchener-Waterloo dropped 6.1 per cent, Greater Vancouver slid 5.6 per cent, and the Greater Toronto Area recorded a 4.5 per cent decrease. Conversely, Victoria bucked the provincial trend with a 0.9 per cent increase, demonstrating why even British Columbia’s real estate landscape defies a single blanket label.
Across the Prairies and Atlantic Canada, varying degrees of momentum remain visible. Regina posted an annual benchmark increase of 3.3 per cent, Winnipeg rose 2.6 per cent, Montreal gained 2.3 per cent, and St. John’s recorded a robust 7.5 per cent jump. These figures represent meaningful divergences from the notable losses witnessed in southern Ontario and the Lower Mainland.
Yet, some annual gains are rapidly becoming stale descriptions of current market realities. Winnipeg’s benchmark slipped 0.2 per cent in August, Montreal fell 0.3 per cent, and Quebec City dropped 0.7 per cent. Greater Moncton maintained a 4.8 per cent annual gain while simultaneously declining 2.9 per cent over a three-month horizon. Prince Edward Island experienced downward pressure across both short-term and annual timelines.
Not every positive figure can be dismissed as a base effect, however. Regina and Saskatoon both managed to post positive monthly and three-month gains, illustrating the utility of distinguishing between markets that are genuinely continuing to advance and those merely living off earlier momentum.
Across Atlantic Canada, the actual share of new listings successfully matched by sales was lower than the previous August in every single province. Newfoundland and Labrador saw its ratio tumble from 77.5 per cent down to 60.1 per cent, while New Brunswick’s ratio fell from 74.6 per cent to 65.3 per cent. These shifts prove that historical annual price gains can easily coexist with a weakening negotiating position for active sellers.
Financing Could Keep the Fall Market Subdued
Looking ahead, the next significant constraint on market activity may stem from mortgage financing terms rather than seller asking prices. Five-year Government of Canada bond yields drifted upward over the course of the summer while the Bank of Canada’s overnight policy rate remained steady. According to CREA, these elevated bond yields have already exerted upward pressure on fixed mortgage rates.
In its most recent policy commentary, the central bank warned that persistently high energy prices had magnified inflation risks, while renewed trade uncertainties could potentially delay business investment and hiring. Higher borrowing costs, combined with mounting anxiety regarding future household incomes, threaten to keep prospective buyers cautious even in markets where purchase prices have declined. While energy-producing regions may experience some localized income benefits, such economic tailwinds do not eliminate broader financing pressures.
Meanwhile, the Canada Mortgage and Housing Corporation’s summer outlook projects that housing starts will continue to drift downward through 2028. Its recent supply reports explicitly warn that a slowdown in ownership-oriented residential construction could ultimately threaten recent gains in housing affordability. However, a shortage of future housing completions will do little to clear out the existing competition currently facing sellers this fall.
For real estate agents and brokers navigating the current environment, market fundamentals point toward the necessity of more realistic listing conversations. Professionals are advised to lean heavily on recent comparable sales data, carefully evaluate the alternative properties available to active buyers, and remain willing to adjust pricing strategies as local market competition shifts. Historical annual gains serve as helpful context, but they do not guarantee that the next prospective buyer will be willing to pay a premium.