
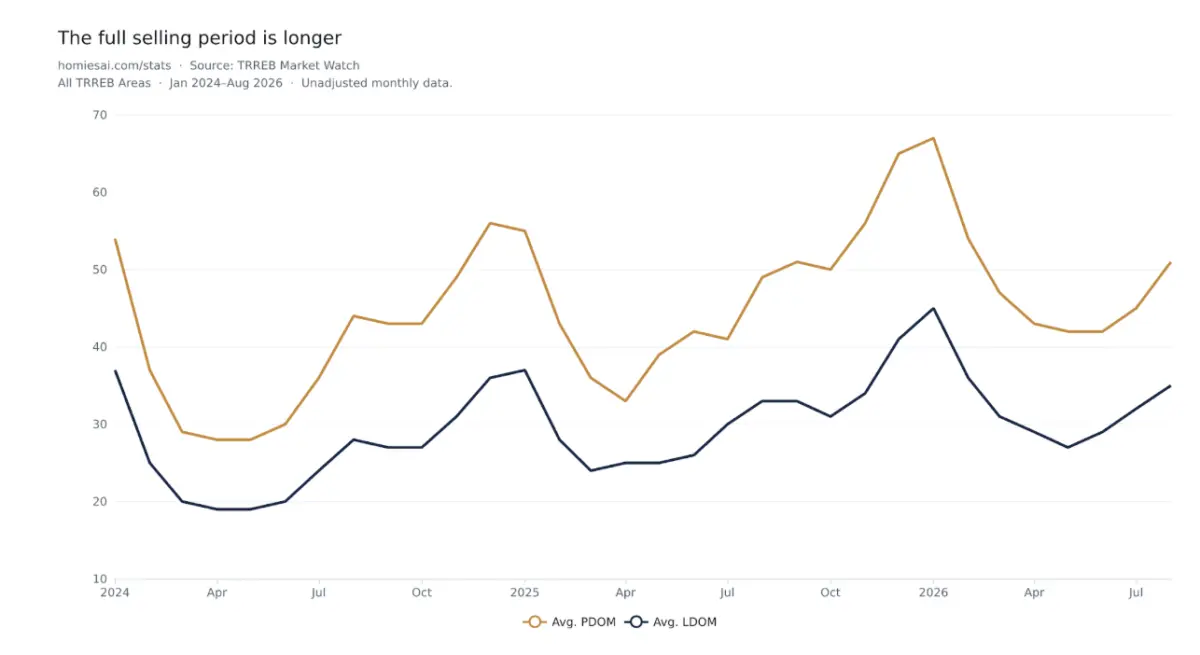
At first glance, a home seller browsing August’s housing headlines across the Greater Toronto Area might reasonably anticipate a smooth and swift transaction. Market reports noted fewer competing listings spread throughout the region, while the Toronto Regional Real Estate Board (TRREB) even raised the possibility of renewed price growth heading into the autumn months. Yet, beneath these optimistic broad strokes lies a more nuanced reality—one captured by a single, critical metric that industry professionals rely on during listing presentations: 51 days.
That figure represents the average property days on market for homes that successfully sold across the region in August, ticking up from 49 days during the same period a year earlier. This comprehensive metric accounts for the entire lifecycle of a listing, including time spent under previous contracts for the same property, provided it complies with TRREB’s tracking guidelines. Meanwhile, the shorter, more conventional listing-days measure—which tracks only the most recent successful contract period—stood at 35 days, up from 33 days a year prior.
Despite a tighter pool of competing listings, properties that found buyers actually took longer to sell than they did twelve months ago. For real estate professionals tasked with managing client expectations ahead of the vital fall market, this distinction is far more consequential than adopting an optimistic label to win a listing.
TRREB’s latest market release reported 5,057 home sales across the region in August, marking a 2.1 per cent decline compared to revised figures from the same month last year. Sales also dipped slightly from July levels once standard seasonal adjustments were applied. Clearly, buyers have not suddenly flooded back into the market with heightened urgency.
The Listing Decline Deserves a Closer Read
A deeper examination of the supply side reveals that new listings fell at a much faster pace than sales. Property owners brought 12,075 homes to market across the Greater Toronto Area in August, representing a notable 14.1 per cent drop from the previous year. For active buyers comparing properties within a specific price bracket, this reduction translates to fewer fresh alternatives entering the inventory stream.
However, aggregate monthly figures cannot easily explain the underlying motivations behind this drop in new supply. An owner might be holding out for a more favorable offer, postponing relocation plans indefinitely, or deciding to remain put in their current residence amid economic uncertainty. Because monthly totals lump these varied motivations together, market analysts must exercise caution before turning a reduction in new listings into a definitive narrative about collective seller psychology.
Furthermore, because the primary benchmark compares one August directly against another, the decline cannot be easily dismissed as mere summer seasonality. At the same time, viewing the unadjusted drop from July as a definitive market turning point would be misleading; TRREB data indicates that new listings actually increased month over month after seasonal adjustments were factored in.
Fewer Listings Still Leaves Plenty to Sell
Even with fewer properties entering the market, inventory remains substantial. By the close of August, 24,482 homes remained actively available for purchase across the region, down 11.3 per cent from August 2025. While this represents a meaningful reduction in total available stock, it still leaves buyers with a substantial pool of competing properties to evaluate.
For any given seller, true competition is not the entire regional inventory, but rather the specific subset of homes that a prospective buyer would realistically consider as alternatives. A property requiring extensive renovations competes directly against fully updated homes once a buyer factors potential repair costs into their purchasing budget. Similarly, a lengthy daily commute shifts the comparative value proposition entirely. While board inventory counts provide a necessary starting point for market conversations, raw inventory numbers alone cannot determine the precise value of an individual listing.
On the pricing front, the average selling price across the region landed at $993,410, marking a 2.7 per cent decrease compared to the previous year. Simultaneously, the composite MLS Home Price Index registered a 4.5 per cent decline over the same timeframe. However, the seasonally adjusted Home Price Index remained virtually flat compared to July figures. While this stabilization offers sellers a reasonable basis to hope that downward price adjustments are moderating, it does not guarantee that an aggressive asking price will find a receptive audience.
Use the Property’s Full Selling History
The widening gap between the 35-day listing measure and the 51-day property-days metric provides a valuable framework for productive pricing discussions. Relisting a property under a new contract can create the illusion of a fresh advertisement, masking the fact that the seller has actually been trying to secure a buyer for a considerably longer period. TRREB’s property-days calculation incorporates earlier listing efforts by the same seller and brokerage within the original contract framework, offering a more transparent starting point for evaluating market history.
Of course, neither statistical measure predicts how long every currently active listing will take to resolve. These averages reflect only the properties that successfully crossed the finish line and completed a sale; homes that remain unsold sit outside the calculation entirely.
To provide comprehensive guidance, real estate professionals often examine the full listing history of the closest comparable properties, including any mid-campaign adjustments to asking prices. Reviewing competing homes that remain unsold is equally instructive, as it helps clarify what features, conditions, or price points prospective buyers have been actively passing over.
The Negotiating Position Changes Across the GTA
Market dynamics vary significantly depending on geography. TRREB’s published sales-to-new-listings trend stood at 41.3 per cent in Durham Region, compared to 34.8 per cent in Peel Region, while Toronto proper recorded 38.3 per cent. These distinct figures underscore the vastly different negotiating environments sellers face across the Greater Toronto Area, even before breaking down the data by specific property types and price ranges.
It is also important to note that TRREB calculates these broad trends using a 12-month moving average. They should not be interpreted as the exact percentage of August’s new listings that successfully sold during the month. Even a straightforward monthly sales-to-listings calculation would inherently compare two disparate groups of properties, given that many August transactions originated from listings introduced in previous months.
For a buyer’s agent, the logical next step is to filter these broad metrics down to the client’s specific search parameters. If suitable alternatives are disappearing from the market and recent comparable sales robustly support a property’s asking price, hesitation carries a tangible cost. Conversely, if a listing repeatedly returns to the market at an unsupported price point, hyper-local statistics alone cannot fix the underlying valuation mismatch.
Give the Seller a Plan They Can Act On
Average property days on market for completed August transactions varied across municipalities, ranging from 46 days in Toronto and Durham to 57 days in Halton, with Peel and York both averaging 55 days. While these regional figures help establish a realistic timeline framework, they do not serve as guarantees for any single property.
Prior to launching a property onto the market, sellers and their representatives benefit from establishing objective criteria that would justify a future price adjustment. This might involve monitoring competing sales closing below asking prices or tracking consistent negative buyer feedback tied to a specific layout or property defect. Agreeing in advance on a scheduled date to review this evidence prevents a listing from drifting aimlessly when initial momentum stalls, replacing a vague hope for a better fall market with concrete decision-making milestones.
September will provide an important test for the regional housing market. An influx of returning sellers could replenish buyer options, while continued sluggishness in new inventory might improve the leverage of well-priced properties even without a significant surge in sales volume. Until those autumn transactions materialize, August data provides sound justification for careful expectation management, but offers little reason to abandon the fundamental benchmark of comparable sales.