
What did a Greater Toronto Area home actually sell for in October? Depending on which metric a client decides to pull up, the answer can vary wildly, revealing a market caught in a complex transition phase defined by cautious buyers, retreating sellers, and sharp regional divides.
According to the latest housing market figures released by the Toronto Regional Real Estate Board (TRREB), the region recorded 5,603 home sales in October, representing a notable 7.9 per cent decline compared to the 6,083 transactions registered during the same month last year. Inventory metrics pointed to a simultaneous cooling on the supply side, as new listings fell 11.9 per cent to 14,173, while active listings dropped 10.0 per cent to finish the month at 25,098. The overarching narrative of the mid-autumn market shows that while buyers have clearly pulled back from active purchasing, sellers have pulled back even harder in response.
The Price Numbers Your Clients Will See
For real estate professionals navigating pricing conversations, understanding how different price metrics paint contrasting pictures has never been more critical. The median sale price for a GTA home in October stood at $860,000, holding flat compared to September but marking a notable retreat from the $900,000 recorded in TRREB’s October 2025 report. Meanwhile, the average selling price came in at $1,024,108, down 2.7 per cent from $1,052,539 recorded last October. At the same time, the MLS Home Price Index (HPI) composite benchmark price settled at $916,400, representing a year-over-year decline of 4.28 per cent.
These varying data points can easily create conflicting impressions for market participants. A client who happens to look at the median price alongside September’s figure might walk away with the false impression that price declines have finally ground to a halt. Conversely, a client who evaluates the MLS HPI benchmark will quickly realize that the broader market correction is very much ongoing. Industry experts emphasize that the benchmark remains the most reliable indicator to trust because it effectively neutralizes distortions caused by shifts in the types of homes changing hands from month to month.
Why the Average and the Benchmark Don’t Match
The fundamental discrepancy between average prices and benchmark figures stems from how these metrics are calculated. Both the median and the average simply describe the specific pool of homes that successfully transacted during a given month. If the composition of property types changes—meaning a higher proportion of expensive homes sells while cheaper segments dry up—the average price can artificially rise even if individual properties have not gained any underlying market value.
That exact dynamic played out across the GTA housing market in October. Detached homes accounted for 2,693 of the total 5,603 sales, representing 48.1 per cent of all transactions. This was up from a 46.5 per cent share in the previous year’s report. In contrast, condo apartment sales fell by 10.4 per cent, and townhouse transactions dropped by 11.0 per cent. When more affordable housing products drop out of the monthly sales mix at a faster pace than higher-end properties, the overall average price gets artificially propped up.
The MLS HPI benchmark strips away these mix effects by pricing a typical benchmark home with fixed, consistent characteristics. As a result, a temporary market shift toward higher-priced detached home sales does not flatter the index. Real estate analysts note that the benchmark figure—showing a 4.28 per cent year-over-year decline—is the metric of choice for grounded, realistic pricing conversations.
By Type, the Benchmark Is Consistent
When examining the market through the lens of the HPI benchmark, every major property type shows consistent year-over-year price declines. Condominium apartments continue to face the most acute downward pressure and remain the softest segment of the entire housing market. The imbalance in the condo sector was stark in October, with 8,100 active condo apartment listings competing against just 1,385 completed sales.
Semi-detached homes stood out as the sole major property type managing to sell above asking price on average, commanding 101 per cent of their list price. Across the entire market, the average sale-to-list price ratio hovered at 97 per cent. Meanwhile, the average number of days a property spent on the market remained steady at 31 days, identical to the figure recorded a year prior. Trend metrics showed months of inventory resting at 4.6, while the sales-to-new-listings ratio stood at 37.9 per cent. Together, these indicators point to a soft, balanced market that is showing no signs of accelerating rapidly.
Durham Is Where October Hurt Most
Regional analysis highlights significant geographic divergence across the Greater Toronto Area, with Durham Region bearing the brunt of October’s market sluggishness. According to regional data tables and market tracking by local real estate professionals, sales in Durham plummeted by 17.6 per cent, dropping from 715 transactions in October 2025 to just 589 this October. This marked the steepest decline among the five core regions of the GTA.
Durham also stood out as the only core region where active listings actually increased, rising 1.9 per cent to 2,619. By comparison, active listings dropped sharply in other areas, falling 15.6 per cent in Peel and 10.1 per cent in York, where sales volumes remained relatively flat. Durham’s average home price fell 6.9 per cent year-over-year to $793,024. Months of inventory in the region crept up from 3.2 to 3.6, while the average sale-to-list price ratio slipped slightly from 99 per cent to 98 per cent. Looking at the broader annual picture, Durham sales are down 10.8 per cent year-to-date.
Local tracking of distressed properties reveals additional headwinds for the Durham market. Power-of-sale listings accounted for 1.85 per cent of all new listings in Durham during October. Furthermore, data compiled at the start of November showed that 62 out of 2,845 active listings in the region—or approximately 2.2 per cent—were power-of-sale properties. This represented the highest share among all tracked regions and exceeded the broader GTA average of 1.5 per cent. For the entirety of 2026, power-of-sale listings have constituted 1.28 per cent of new listings in Durham, marking a substantial increase compared to the 0.15 per cent baseline recorded in 2021. Real estate advisors stress that these distressed properties have effectively become part of the active comparable sales data that agents must navigate in the region.
The Whole GTA Is on Pace for Its Weakest Year in a Decade
The broader regional slowdown has placed the entire GTA housing market on track to record its lowest annual sales volume in a decade. Cumulative sales for the first ten months of the year reached 52,694. To match the revised total of 62,310 sales achieved in 2025, the market would need to generate 9,616 transactions across November and December—an 11.4 per cent increase over the volume recorded in those two final months last year. Given that both September and October lagged significantly behind their 2025 counterparts, market observers consider such a rebound unlikely.
If sales volumes in November and December simply match the performance of the previous year, 2026 will close with approximately 61,324 total sales. Such a figure would sit below every annual total recorded in TRREB’s historical data tables stretching back to 2013, and would amount to less than half of the record-breaking sales volume observed in 2021.
416, 905 and the Builder Down the Street
Detached home performance diverged sharply between the City of Toronto and the surrounding suburban municipalities in October. Within the 416 area code, detached home sales edged up by 0.5 per cent, while the average price dipped a modest 1.2 per cent to $1,603,886, reflecting relative stability. In contrast, the 905 suburban ring experienced a 6.2 per cent decline in sales, accompanied by a 4.7 per cent drop in the average detached price to $1,199,303. Because the 905 accounts for roughly 72 per cent of all detached sales in the region, weakness in the suburbs disproportionately pulls down the aggregate GTA statistics.
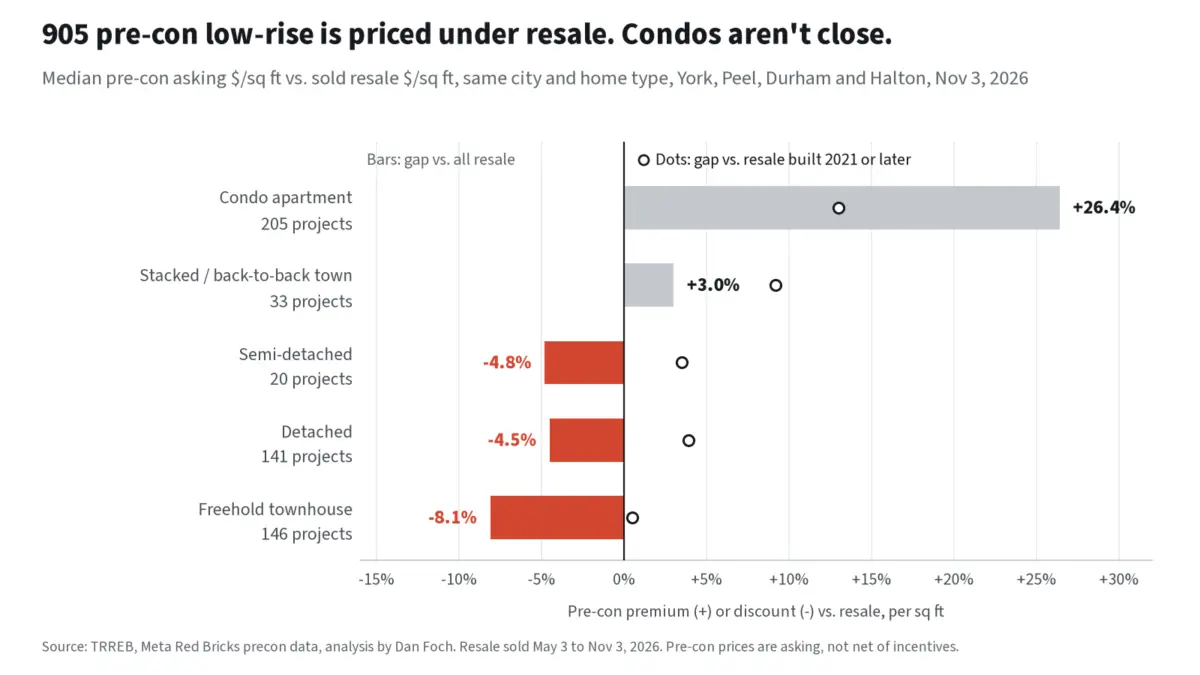
This suburban softness is partly tied to competition from new construction projects. An analysis comparing actively selling preconstruction low-rise projects across the 905 against sold resale properties in the same municipalities and property categories reveals notable price gaps. Preconstruction freehold townhomes were listed at prices averaging 8.1 per cent lower per square foot than comparable resale properties, while preconstruction detached homes asked 4.5 per cent less. The discount was even more pronounced in specific submarkets, such as Halton, where preconstruction detached homes priced themselves 12.1 per cent below resale comparables, and Durham, where preconstruction detached and freehold townhomes sat 10.9 per cent and 9.8 per cent lower, respectively. When compared exclusively against properties built between 2021 and the present, the pricing gap narrowed to within four per cent in either direction. Industry experts advise agents listing newer resale homes built in recent years to carefully review nearby builder price sheets before finalizing listing strategies, as modern buyers routinely evaluate these alternatives.
Rates Went the Wrong Way
Financing conditions continued to pose a psychological and financial hurdle for market participants. The Bank of Canada’s overnight lending rate sat at 2.5 per cent following a rate hike, with TRREB reporting the prime rate at 4.5 per cent. Meanwhile, headline inflation stood at 3.1 per cent in September, and posted five-year conventional mortgage rates tracked in the board’s report reached 6.19 per cent.
While TRREB’s official commentary suggests that lower home prices are successfully helping to offset the impact of higher borrowing costs on monthly mortgage payments, market analysts point out that elevated rates continue to cause hesitation among prospective buyers who are waiting for clearer monetary policy direction. Although TRREB also noted modest month-over-month increases in seasonally adjusted sales, new listings, benchmark prices, and average prices compared to September, analysts emphasize that a sustained trend spanning at least three consecutive months would be required before declaring a definitive turning point in market direction.
What to Tell Clients
For real estate professionals advising clients in the current climate, maintaining realistic expectations is essential. Buyers retain a clear structural advantage in negotiations. With benchmark prices trending downward across all major property types and the average home continuing to trade below its initial asking price, agents should caution clients against entering competitive bidding situations based solely on flat month-over-month median numbers. Semi-detached properties remain the primary exception to this rule, requiring properly calibrated expectations.
Sellers must base their pricing strategies on the specific benchmark trends relevant to their property type and local geography, while anticipating an average sale-to-list ratio of roughly 97 per cent. In regions like Durham, vendors must also factor in active competition from power-of-sale listings and nearby new construction projects priced below traditional resale values. When evaluating neighboring property sales that appear strong, agents and sellers should verify whether the figures are being artificially flattered by product mix shifts. By presenting median, average, and benchmark statistics side by side and clearly explaining the underlying mix effects early in the advisory process, real estate professionals can establish accurate pricing from the outset and navigate an otherwise challenging market successfully.